Please click on links, titles or images below:
Eagle Scout Project at Jacob’s Park
Sinking Creek Restoration & Education Park Development presented at 2014 Tennessee Environmental Conference
Tri Cities Health & Wellness Magazine April 2014
Jacob’s Lesson for Saving Lives
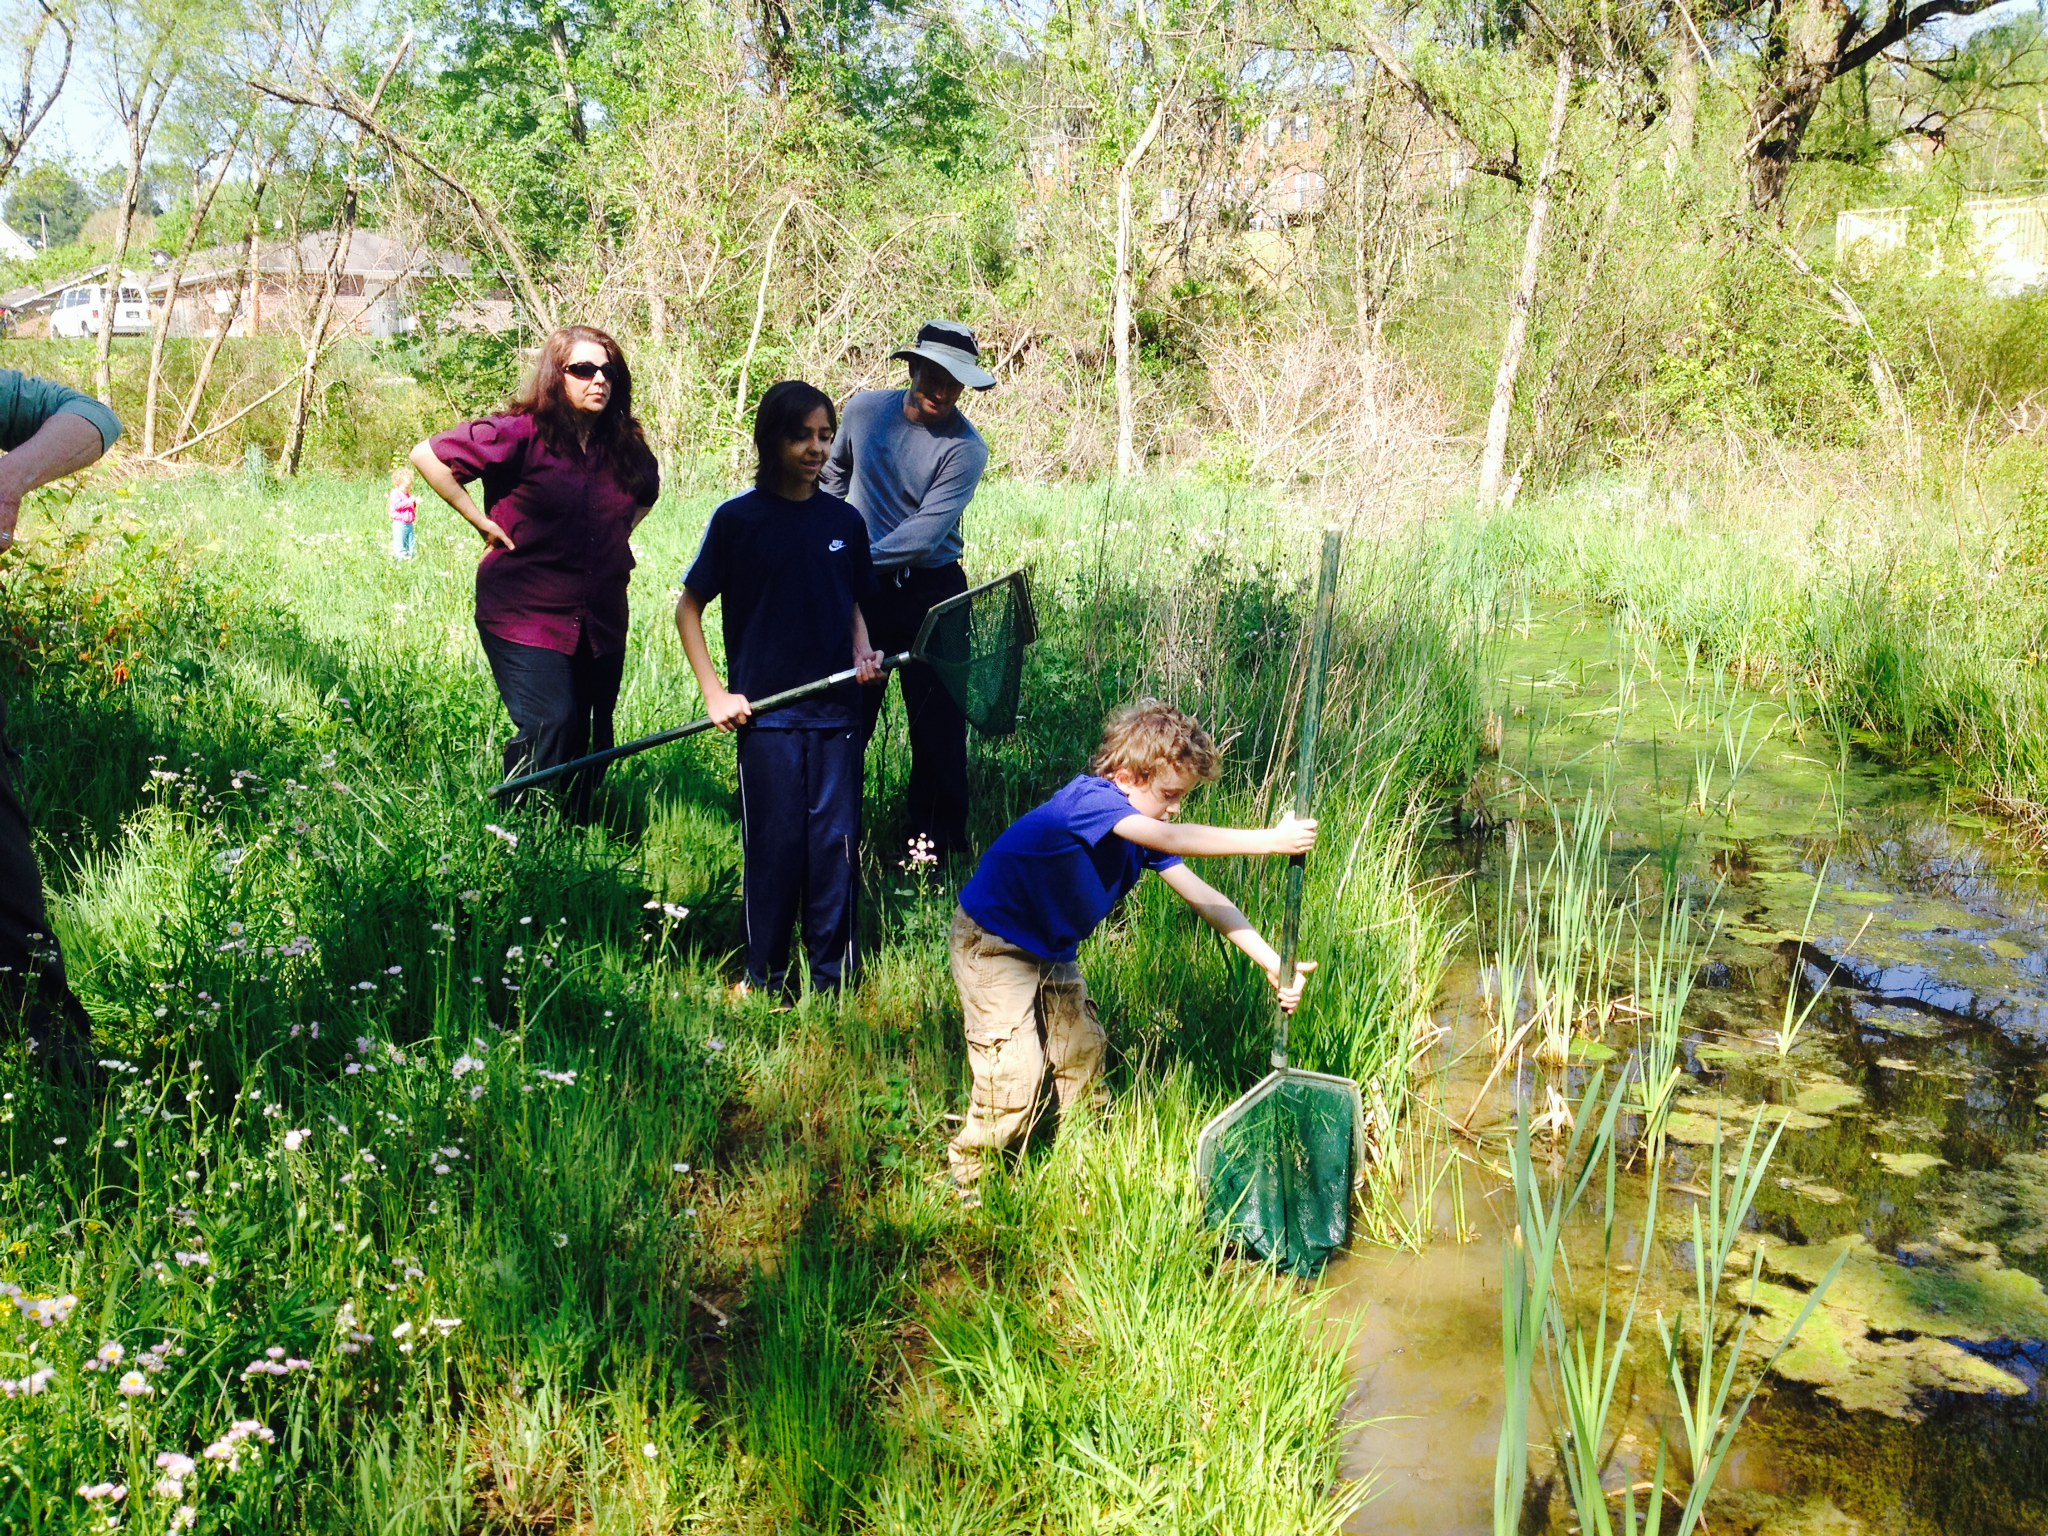
1st Nature Program at Jacob’s Nature Park at Sinking Creek: AMPHIBIANS IN VERNAL POOL by Johnson City Parks & Recreation Nature Program Coordinator, Ms. Connie Deegan. (5/2/15)
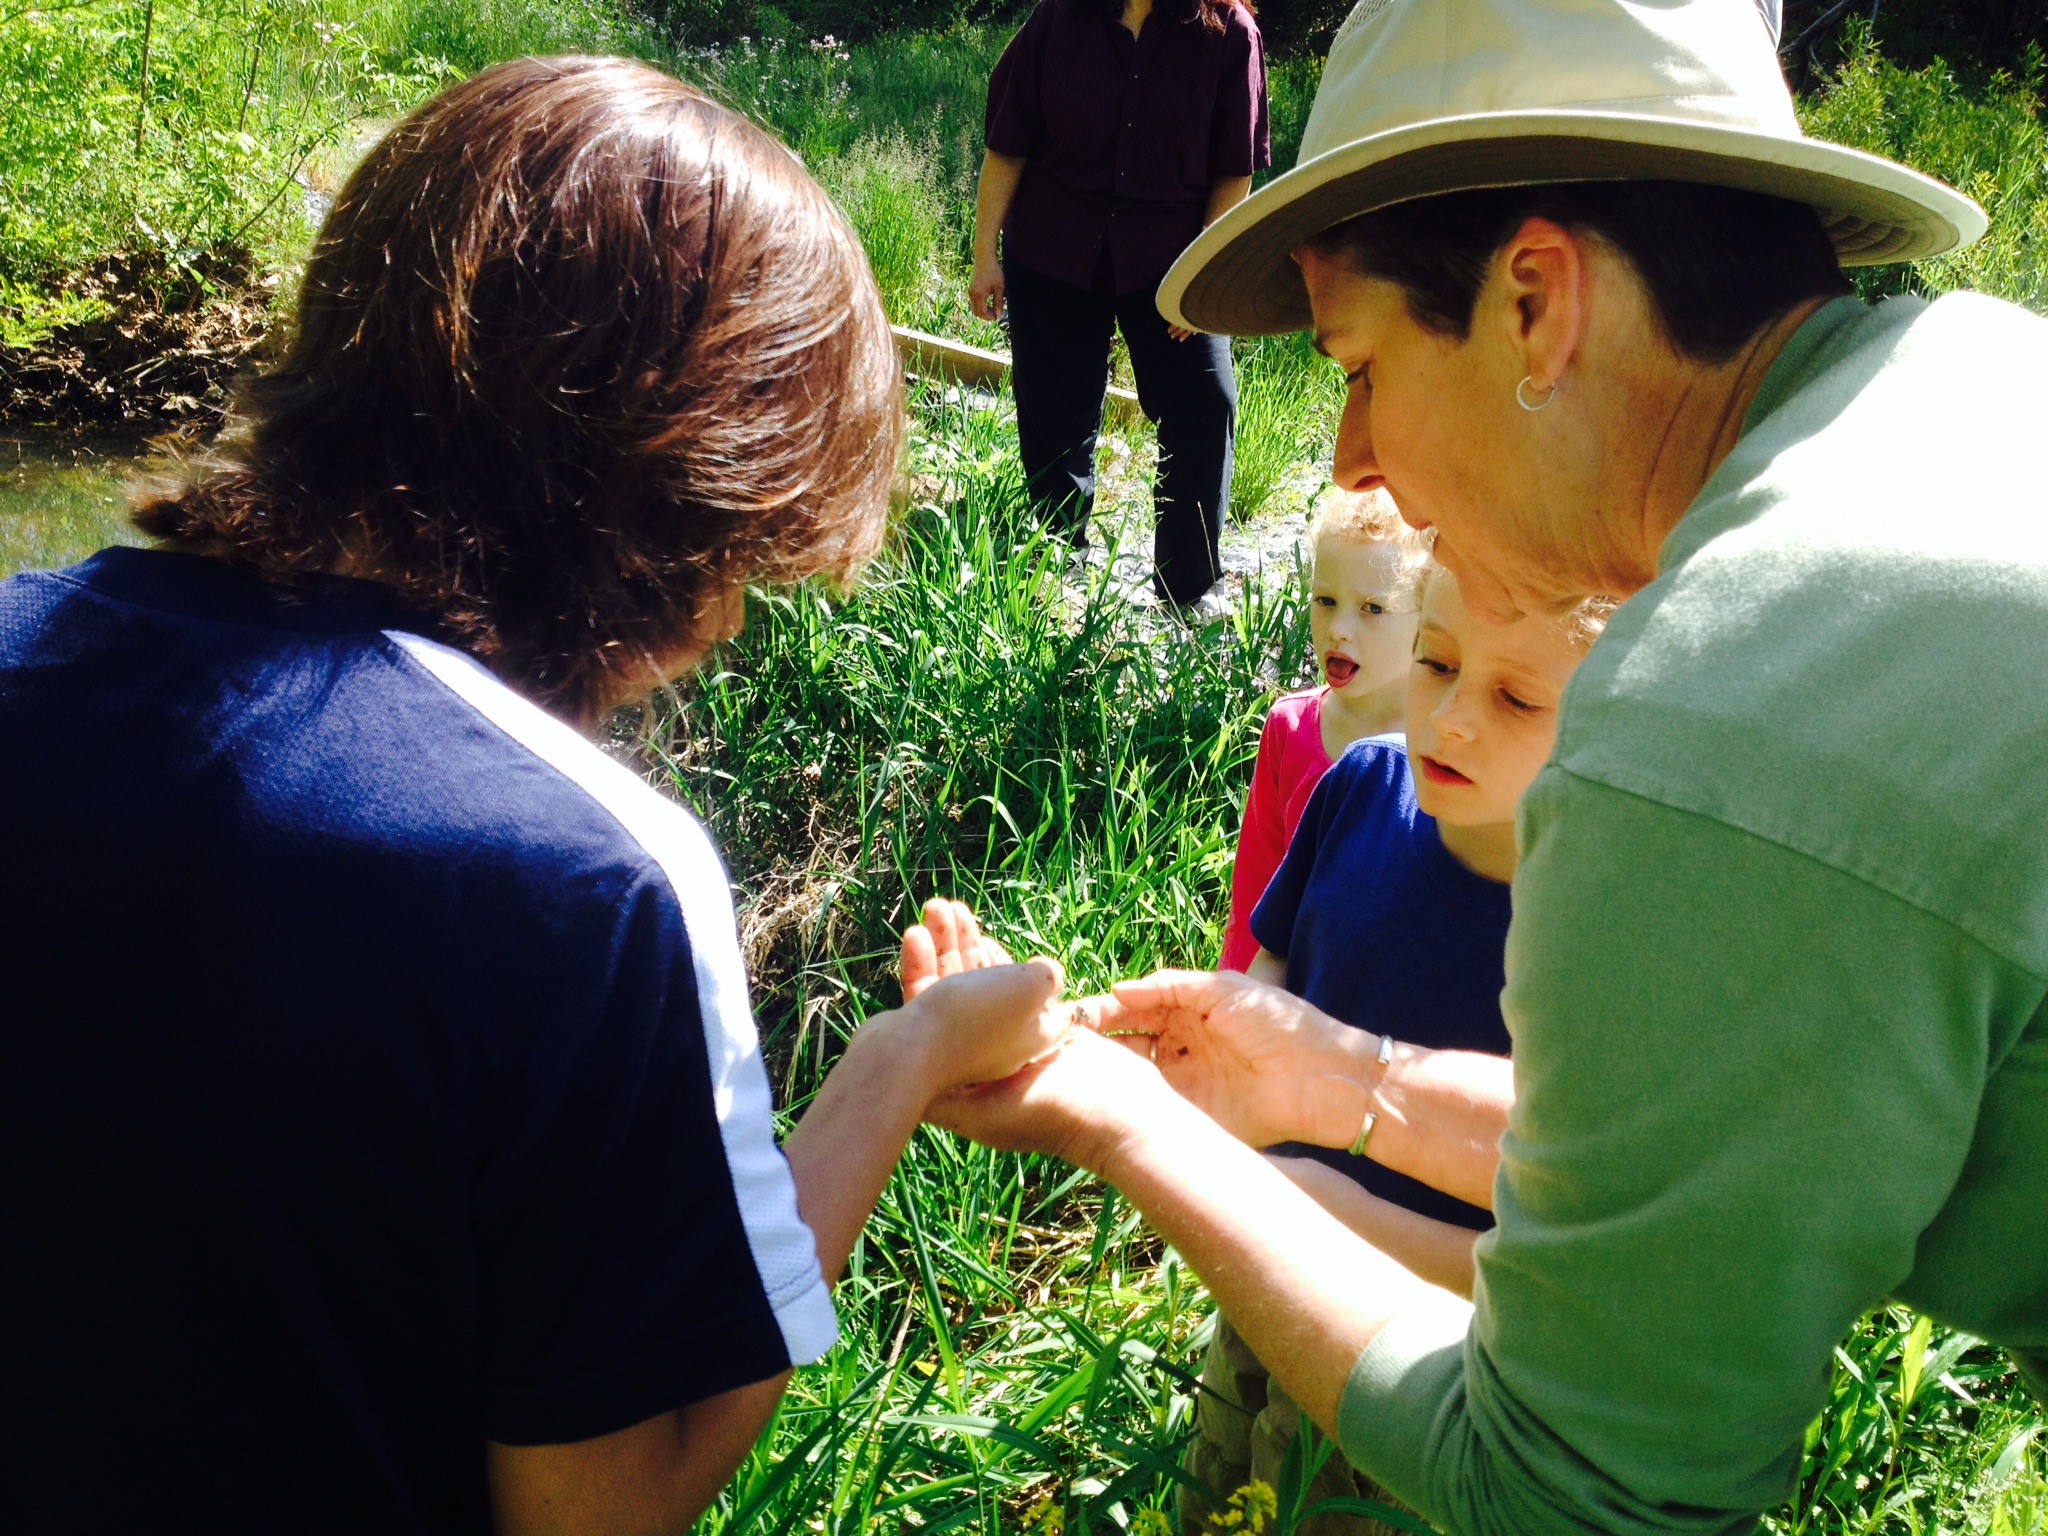
Catching & Inspecting Salamanders: Did you know that there are more species of salamanders in northeast Tennessee than any other place in the world?! While teaching nature, she emphasizes not touching faces while exploring and washing hands when finished. She carries hand sanitizer with her all the time in her job.
ETSU Studies:
Bennett, A.L. and Luffman, I.E., Turbidity and Rainfall in a Small Watershed in Northeast Tennessee, presented at the Geological Society of America Southeastern Section meeting in Columbia SC on 3/31/16.
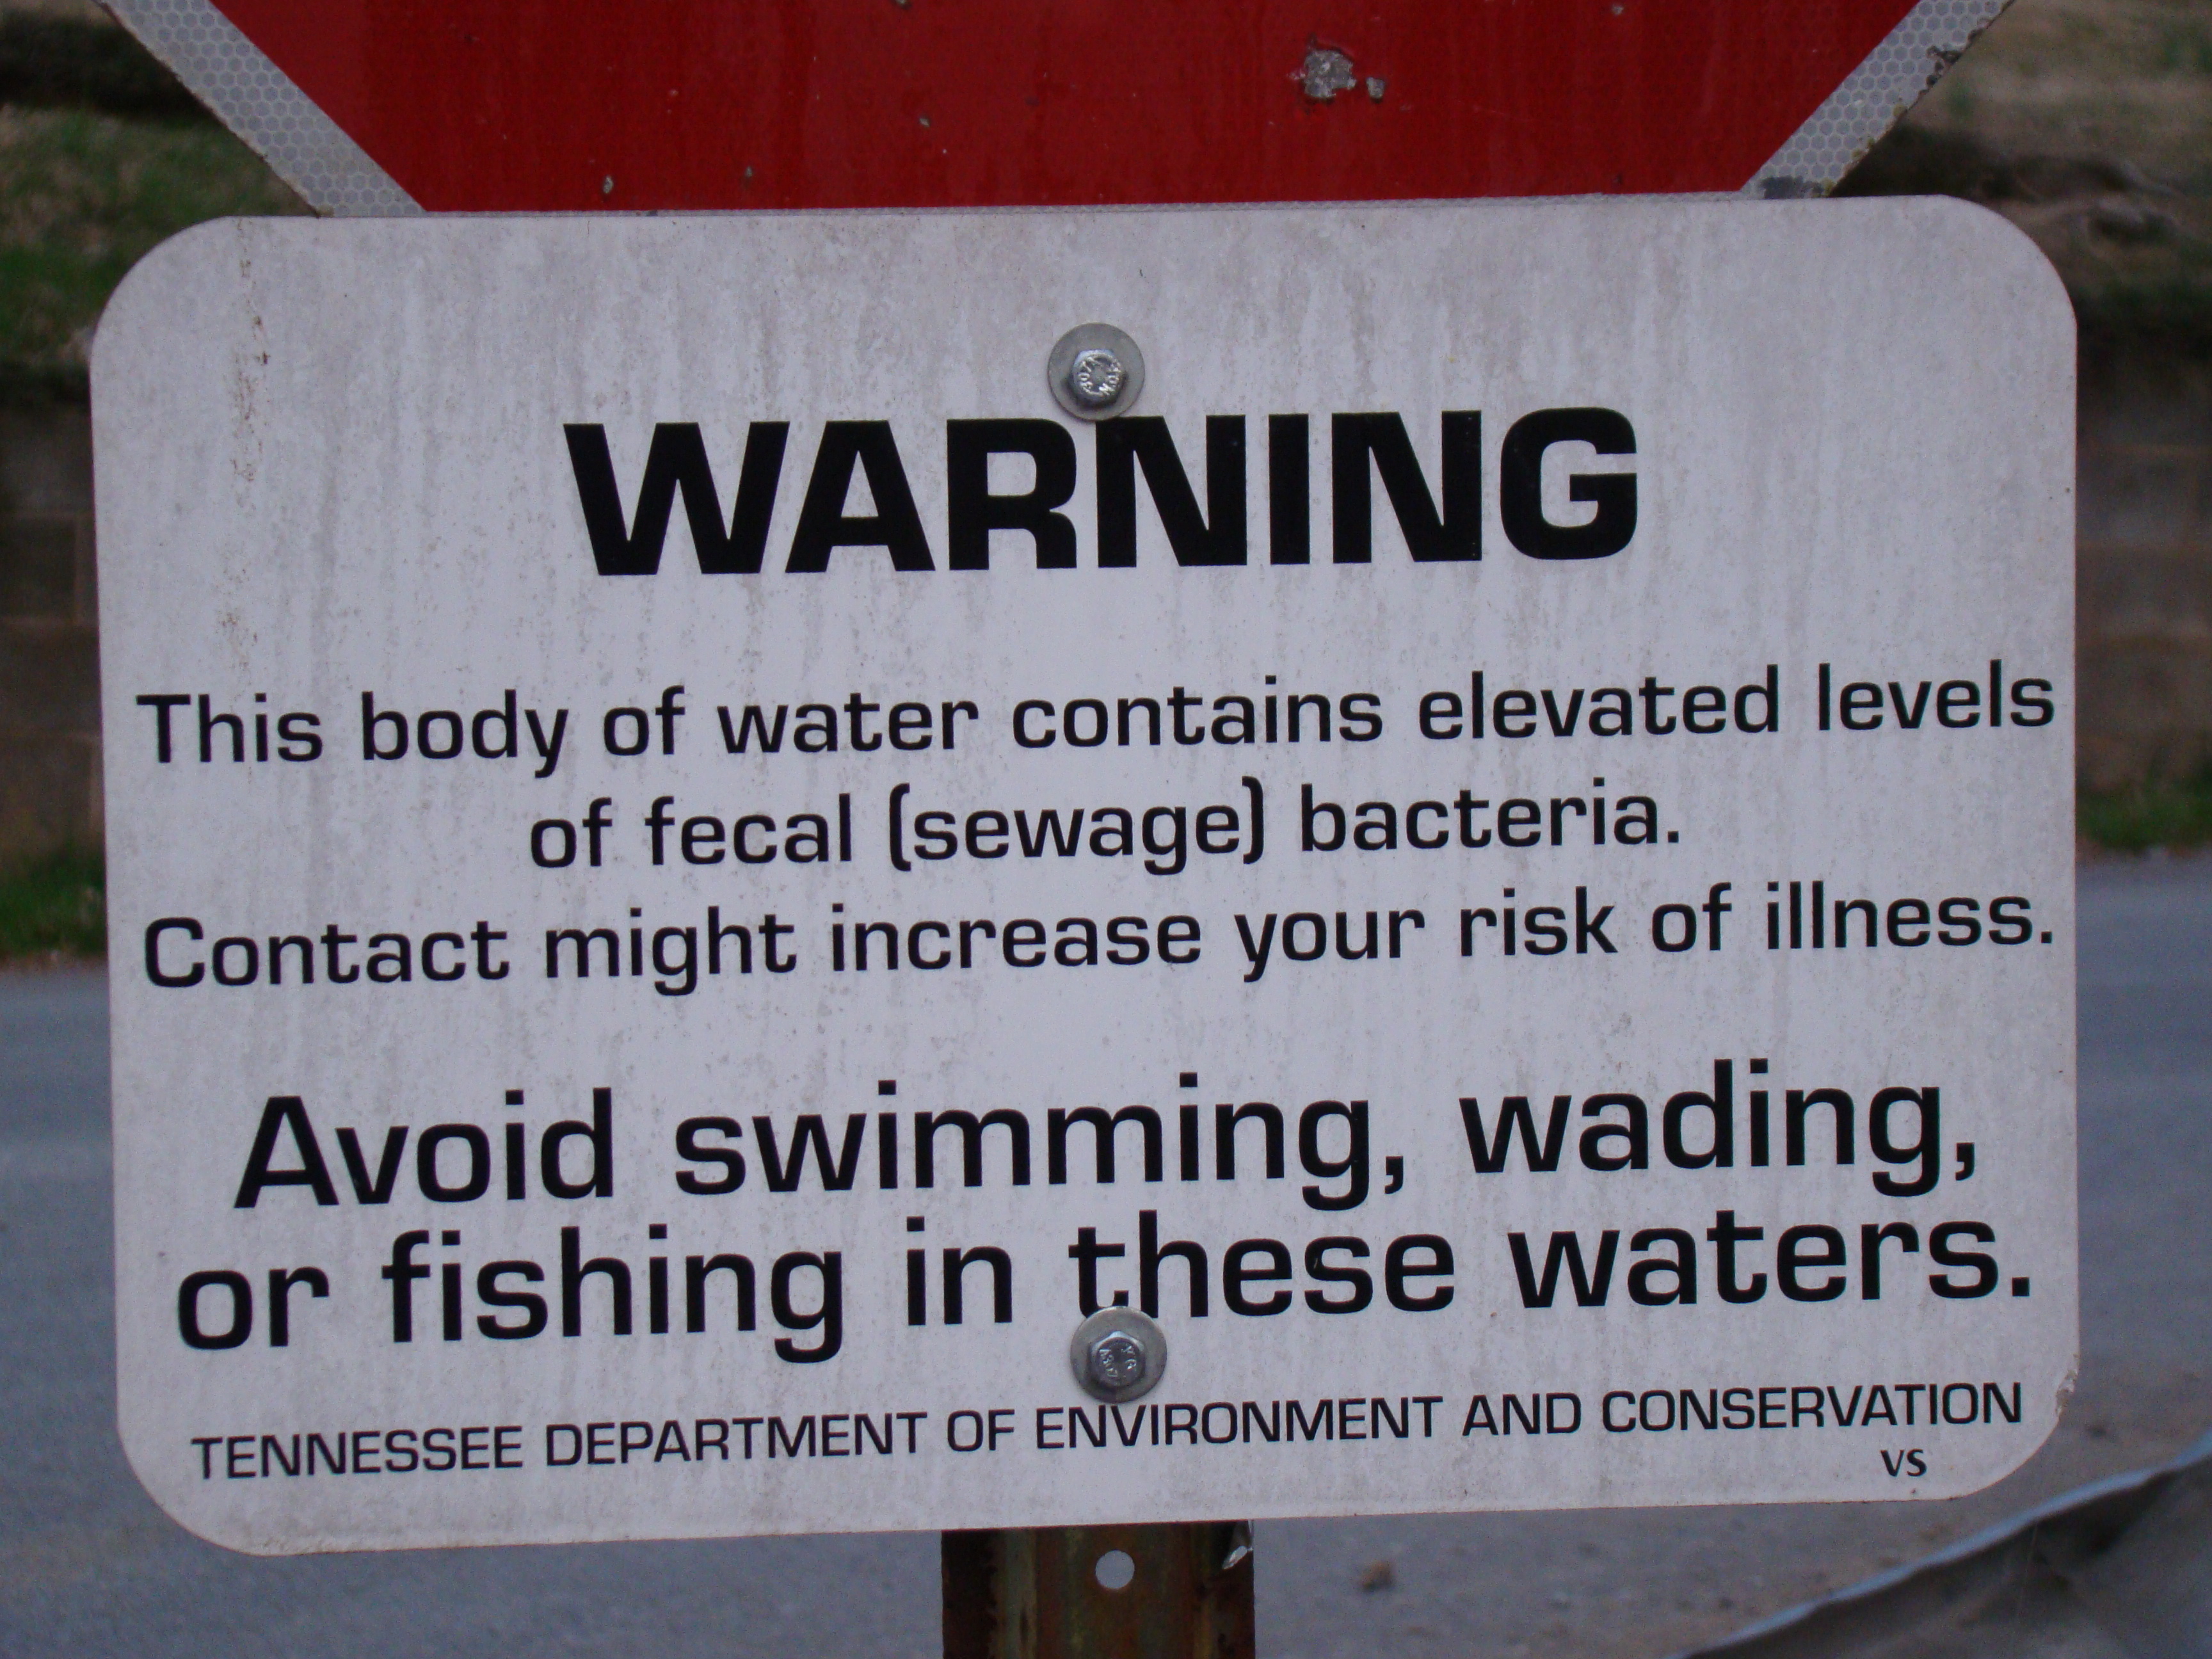
Excess turbidity is a cause of surface water impairment for fish and aquatic life, and has been shown to be positively correlated to pathogen impairment. Turbidity in Tennessee streams is of special concern as sedimentation is the second ranking cause of surface water impairment after Escherichia Coli, with 9934.15 km (6,172.8 miles) of sediment impaired streams reported in the state for 2012 (representing 21.7% of assessed waters). While the correlation between turbidity and rainfall is well established, previous research has focused on longer timescales and therefore the relationship between turbidity and rainfall at the hourly timescale is poorly understood. During a 14-day period in Fall 2015, a data-logging rain gauge was deployed, and n=337 hourly water samples were collected from Sinking Creek (HUC14-06010103000325) at Jacob’s Nature Park in Johnson City, Tennessee. The collection site was 365 meters (1,200 feet) downstream from a sediment impaired tributary (Catbird Creek). Two small rainfall events occurred during the study period, andturbidity was compared to precipitation accumulation and intensity using cross-correlation. A small statistically significant Spearman correlation between precipitation accumulation and turbidity exists at lags of 2 through 8 hours following a rainfall event (r=0.127 to 0.203, p<0.05). Similarly, a small statistically significant Spearman correlation exists between precipitation rate and turbidity at lags of 2 through 8 hours following a rainfall event (r=0.123 to 0.2, p<0.05). Linear regression models on turbidity at various lags explained only 4% of the variability in turbidity.
2016 Poster Bennett and Luffman GSA Southeast
Luffman, I.E., Precipitation-Conductivity-Turbidity Response for a Small Watershed in East Tennessee, USA, presented at the American Association of Geographers meeting in San Francisco CA on 3/31/16.
Excess sedimentation is the primary pollutant in Tennessee’s Watauga River Watershed (HUC 06010103) with 159.4 sediment-impaired stream miles (of 717 total miles). Streams impaired with E. coli come in second, at 117.5 impaired miles. In 2014, a restoration project for E. coli was completed in the Sinking Creek subwatershed (HUC 06010103046) that included projects for cattle exclusion, sewer connections, and construction of a wetlands area. During the restoration work, Sinking Creek’s largest tributary was listed as impaired due to excess sediment. This study quantifies Sinking Creek’s turbidity and conductivity response to precipitation downstream from the confluence of the tributary, and upstream of the wetlands. Turbidity was measured hourly from Oct. 24-Nov. 5 2015, and stream discharge was measured daily. Precipitation and electrical conductivity (EC) were measured at 5 minute intervals using data loggers and aggregated to hourly data. A lag of 3 to 4 hours between precipitation onset and increase in turbidity was identified. Principal Components Analysis was used to extract two orthogonal components representing precipitation and discharge/EC. Regression models explained between 18 and 20% of the variability in turbidity; inclusion of other factors such as antecedent precipitation and soil moisture will likely improve future models.
2016 Poster Luffman AAG Sinking Creek Turbidity 03-28-16
NCUR Account Council on Undergraduate Research
Jacob’s Nature Park: The metamorphosis continues (jcnewsandneighbor.com)
Jacob’s Nature Park to open arboretum | | johnsoncitypress.com
Jacob’s Nature Park adds state certified arboretum designation (jcnewsandneighbor.com)
Sydney on the Trails: Jacob’s Nature Park | WJHL | Tri-Cities News & Weather
Johnson City’s Jacob’s Nature Park gains national recognition (wjhl.com)
